
A deep survey, easy to read
IDIS · Pesquisa Doação Brasil website
We took the Pesquisa Doação Brasil to a website where anyone can find, understand and cross-reference data on giving in Brazil.
The Pesquisa Doação Brasil is the only survey in the country dedicated to the behavior of individual donors. It runs to dozens of questions, each with its own breakdowns and tables. The challenge was fitting such a deep study into the routine of the people who use it most: nonprofits and the press, who need to find a figure fast and understand what it says.
Built for the people who use it
Nonprofits and the press: people who need to find the figure fast.
From highlight to detail
The main findings at the entrance, the full study for anyone who wants to dig in.
The breakdown people look for
Cross-references made right in the chart, no spreadsheet download.
Combined know-how
IDIS, Ipsos and Métrica.Social deciding together how to show each figure.
Find, understand and cross-reference the data, all on the website.
We worked side by side with IDIS, which coordinates the survey, and with Ipsos, one of the largest research companies in the world, which conducts it. They brought the data; we brought the way to show it.
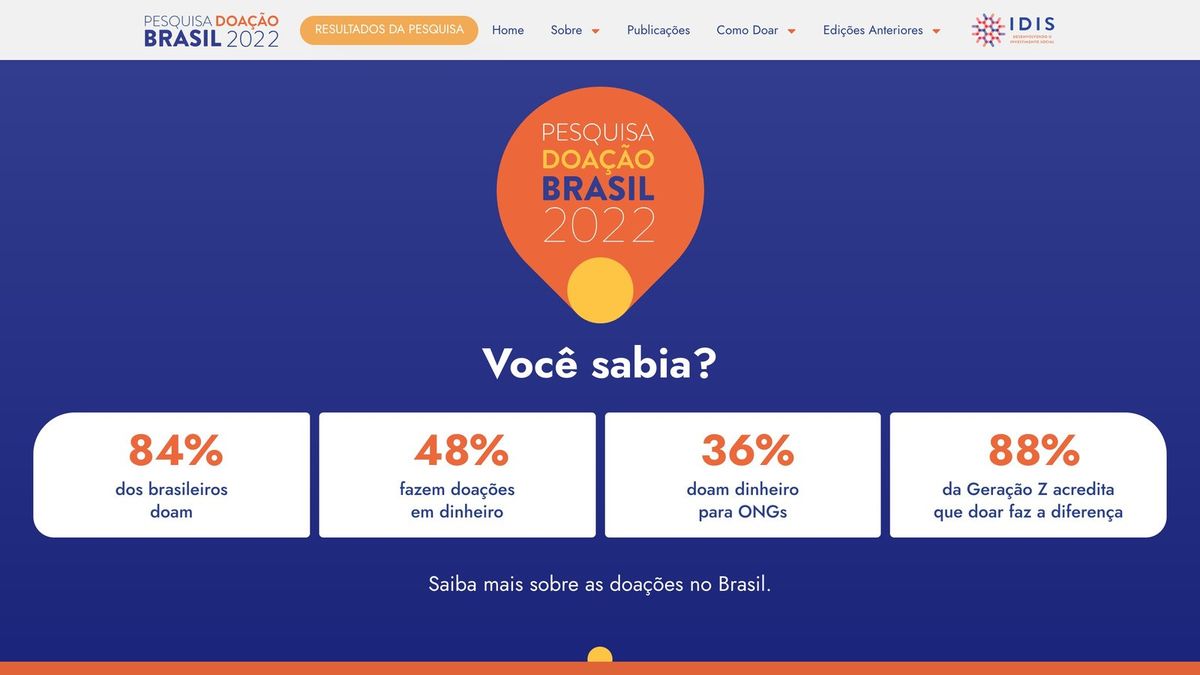
The strongest numbers right at the top
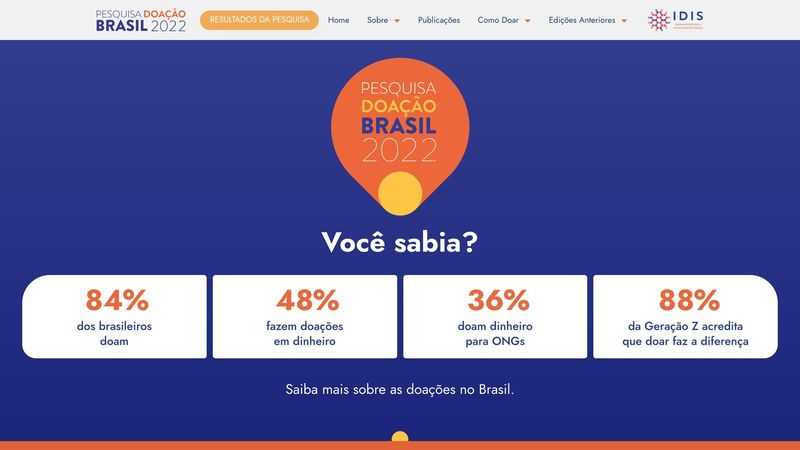
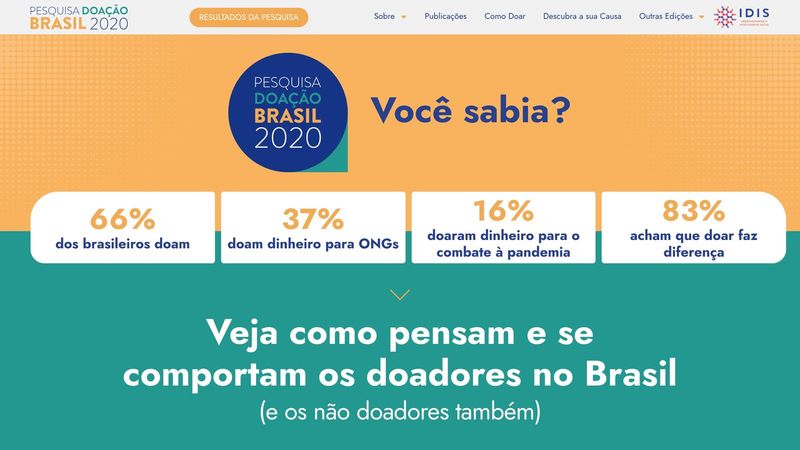
Before any menu, the header already delivers four headline figures from the survey, like the 84% of Brazilians who give. It is the invitation to go find out the rest.
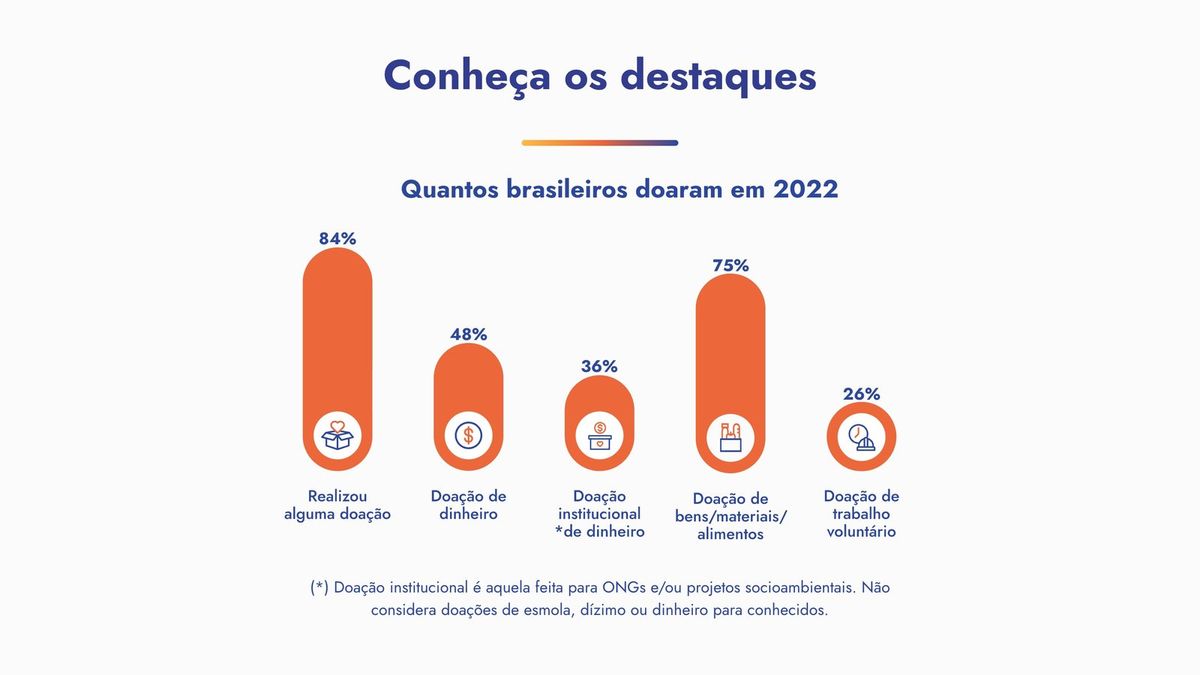
Highlights on the home page
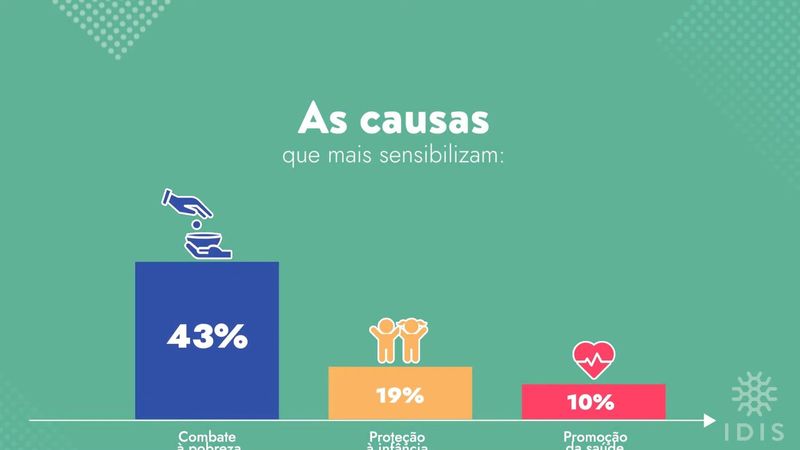
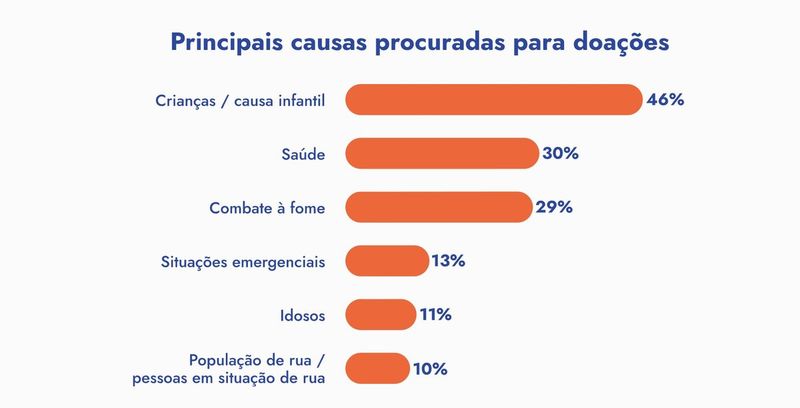
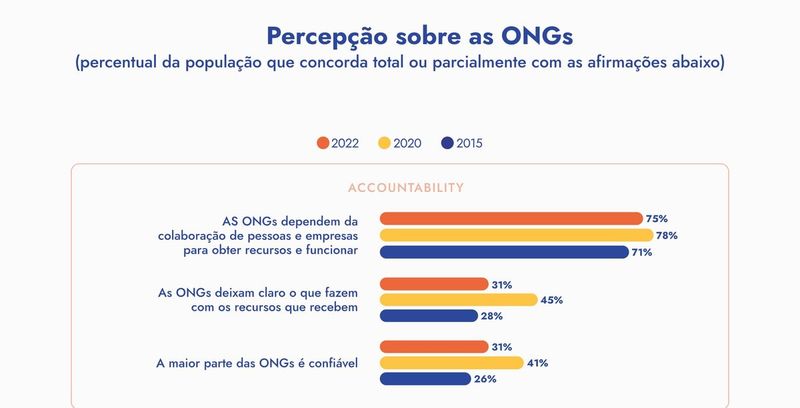
Right below, the home page sums up the edition's biggest findings in short charts: how many Brazilians gave, how much was given, which causes move people most and what people think of NGOs. Anyone in a hurry leaves with the essentials.
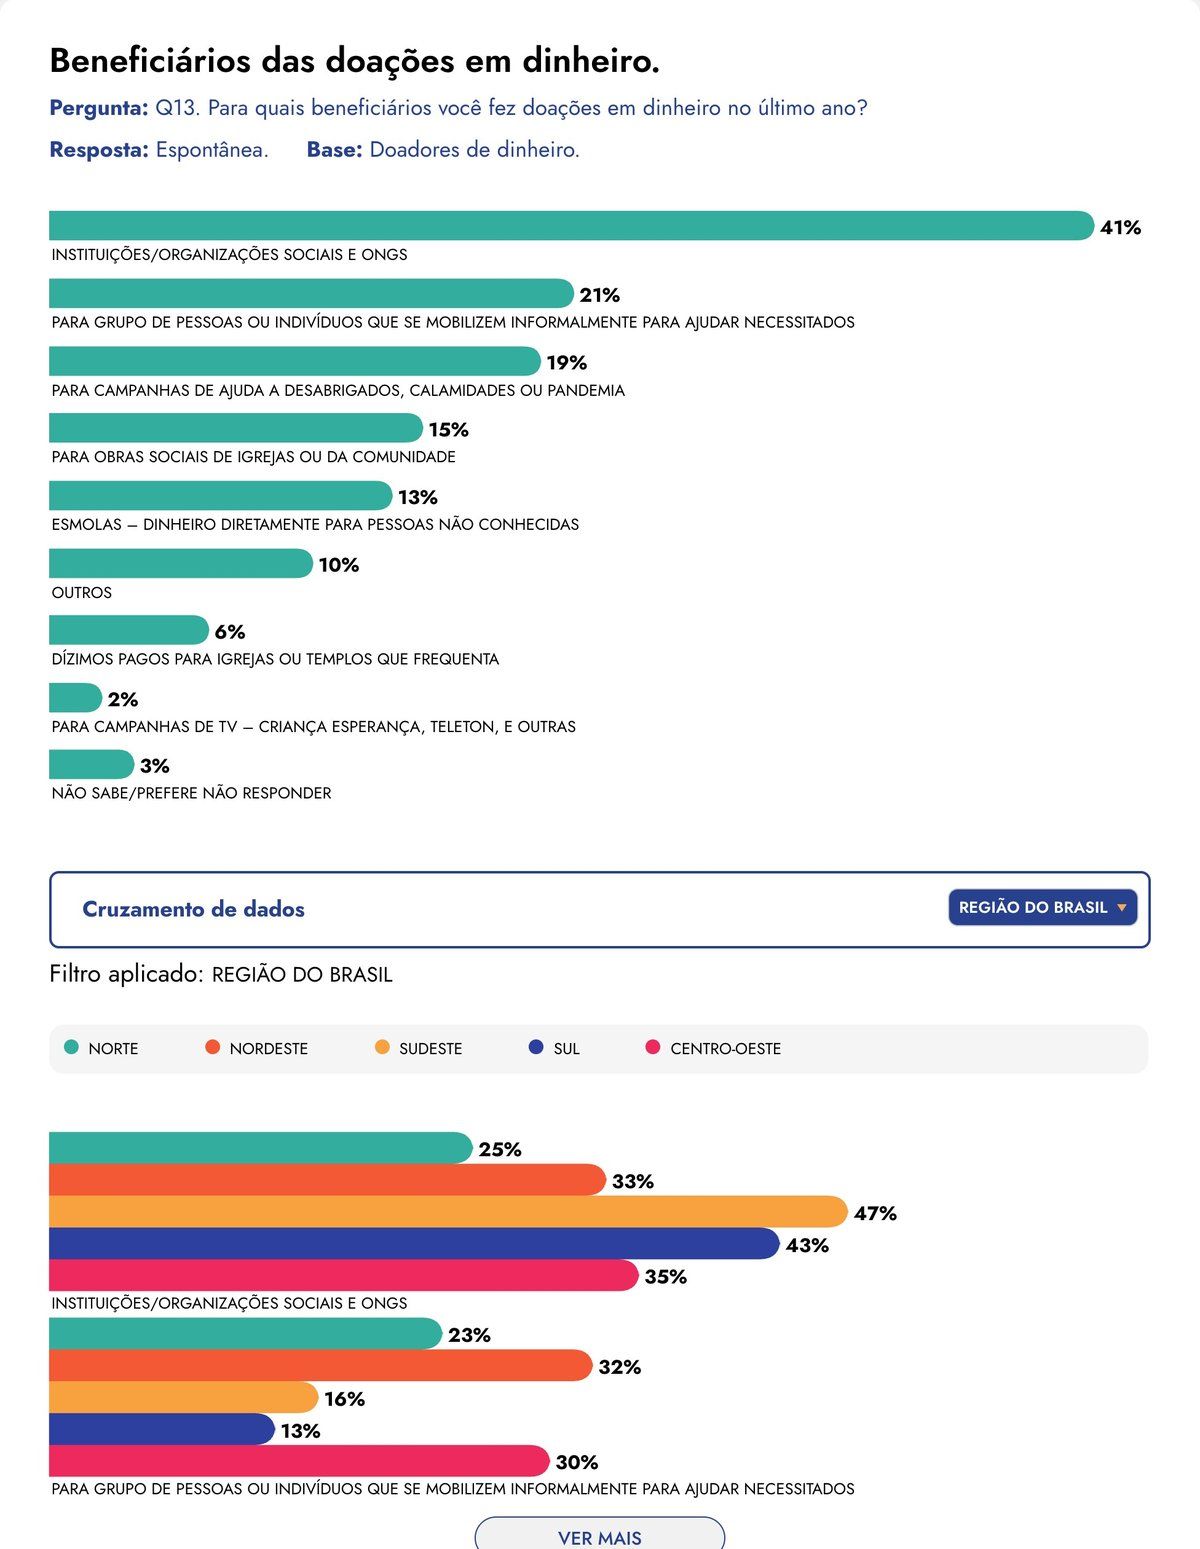
Cross-reference data in one click
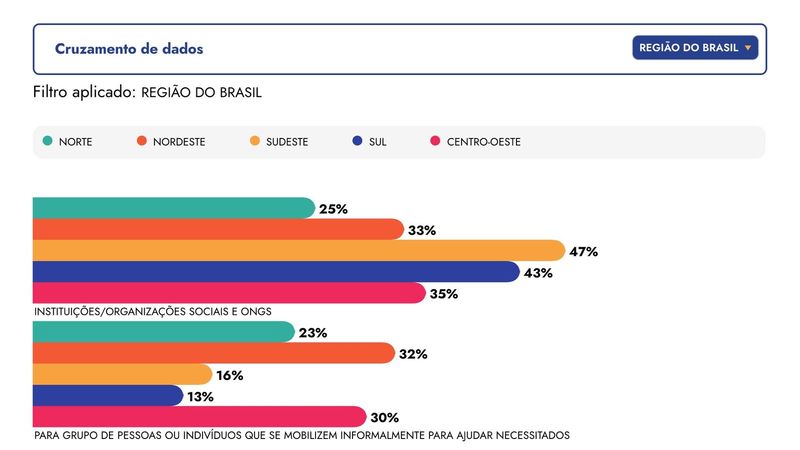
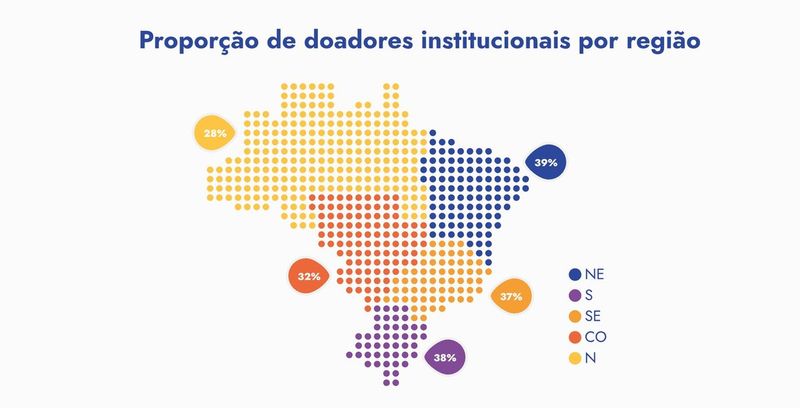
Who gives money and who gives in each region were separate figures. We built a system that crosses them inside the website itself: on every chart, people pick a breakdown, such as region, income, age, gender or education, and the chart redraws on the spot. Finding out which region gave the most money became a single click.
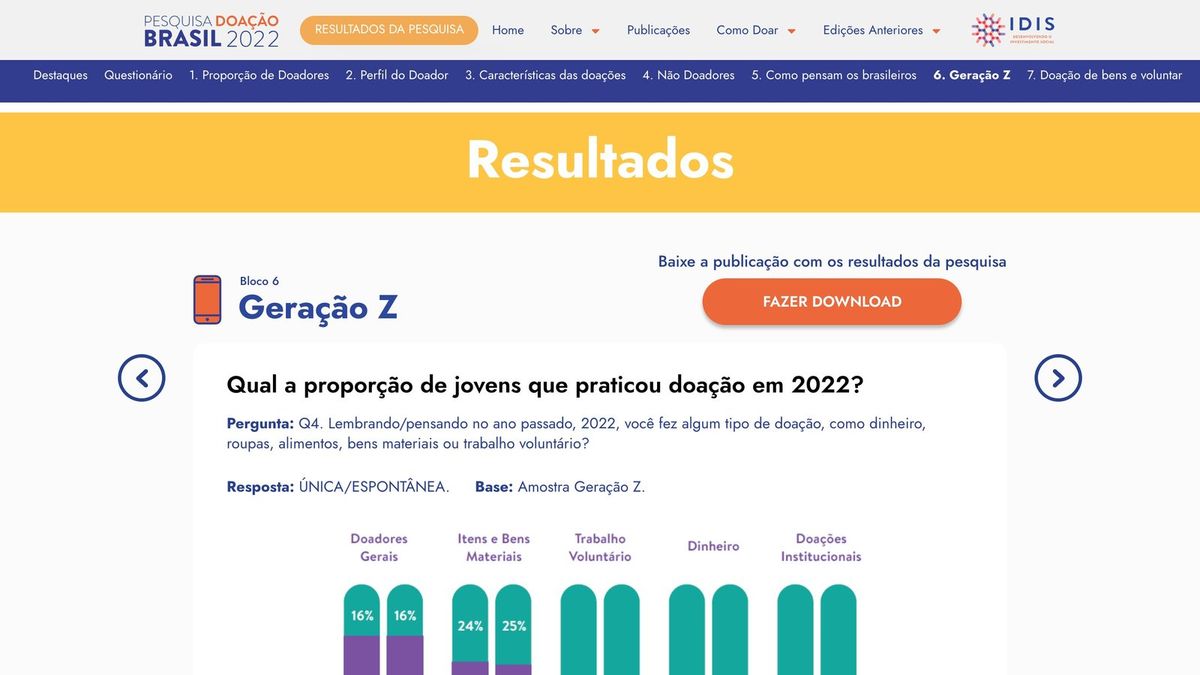
The survey in sections, the website too
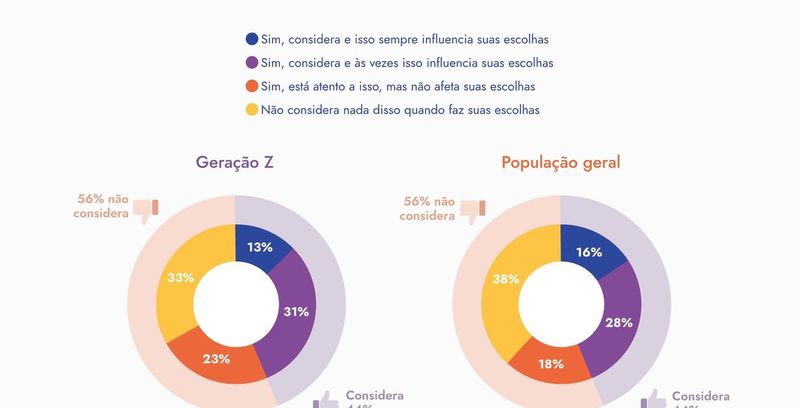
The survey is organized into thematic sections, such as donor profile, characteristics of giving and Gen Z. The website mirrors that logic in the menu and in a submenu inside the results, with arrows to move from question to question. People always know where they are and where they can go.
The right chart for each figure
Together with the IDIS team, we chose the chart type for each piece of information: bars for rankings, grouped bars to compare editions, donuts for proportions, a map for regions. All drawn in the survey's identity, so the figure reads on its own.
Download it, leave your contact
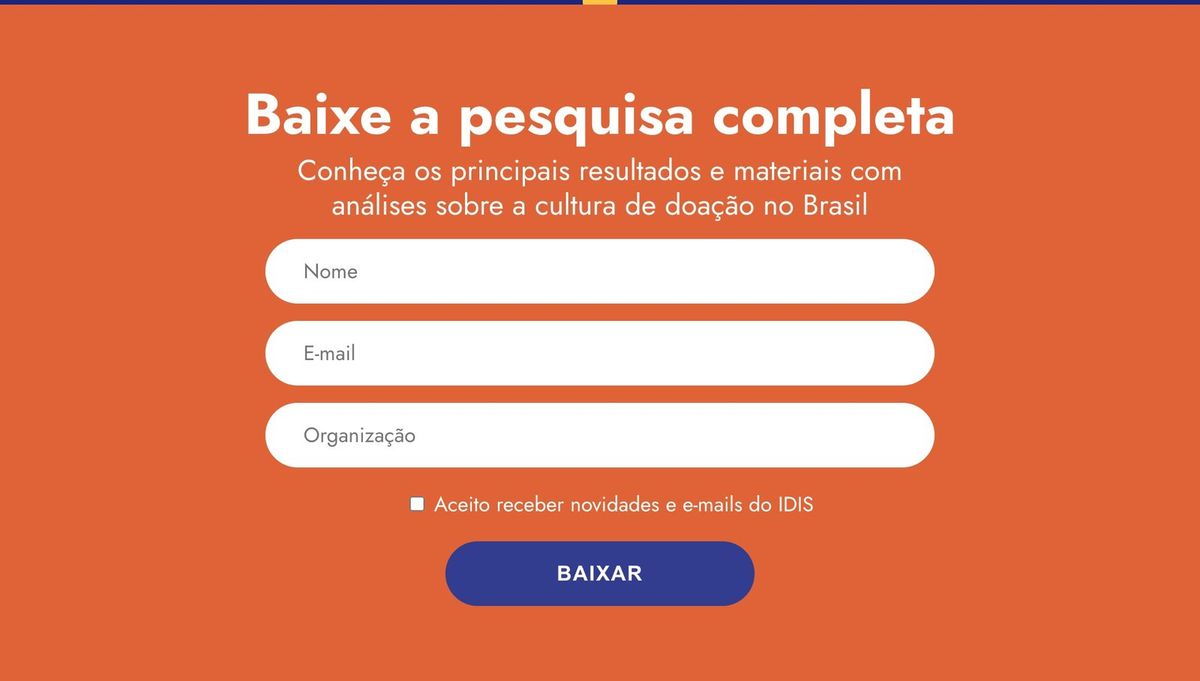
The full survey, as a PDF with the tables, sits one form away: name, email and organization. Every download becomes a contact for IDIS to keep the conversation about giving culture going.
A video for the launch
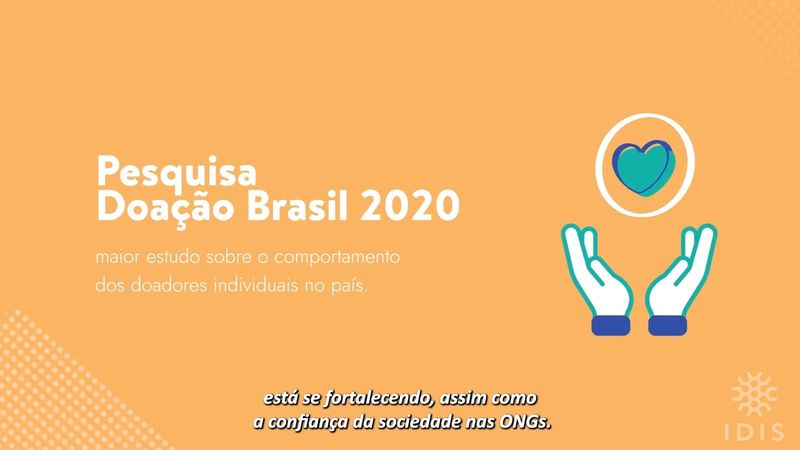
We produced a minute-and-a-half explainer video with the main findings and a tour of the website, used to promote the survey.
The artwork
Screens from both editions and frames from the launch video.
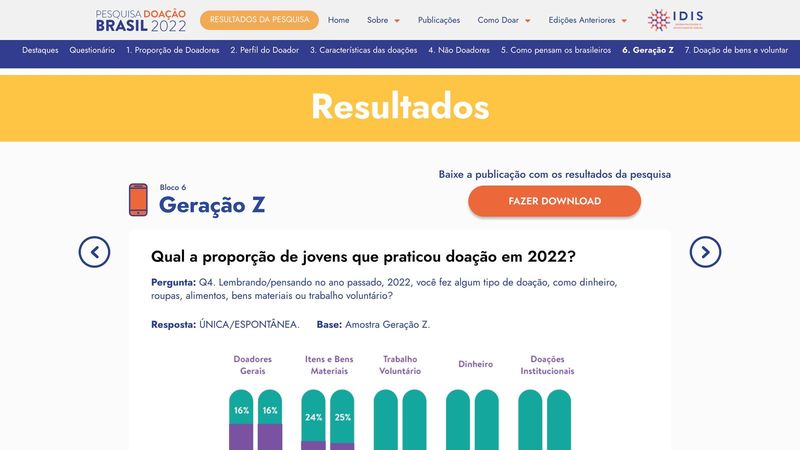
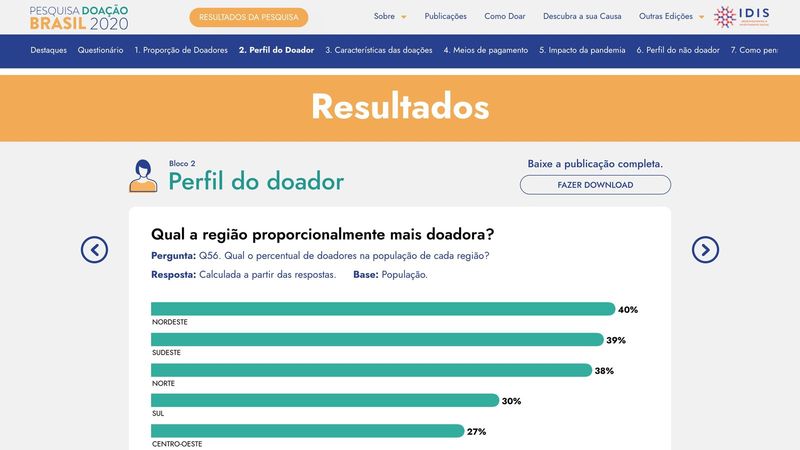
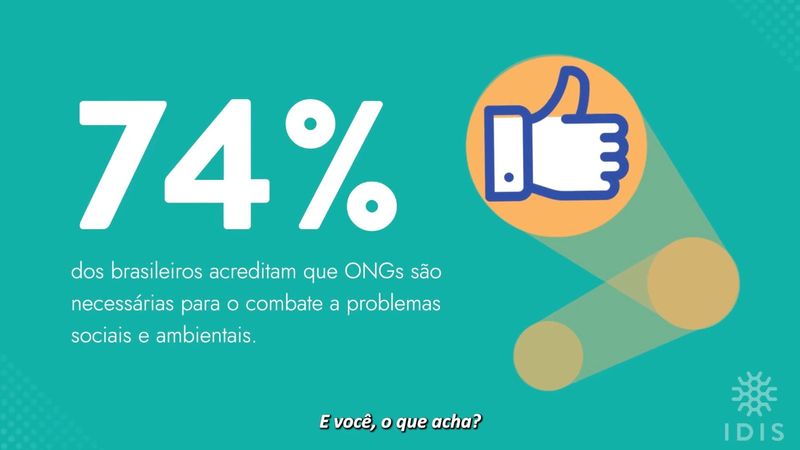
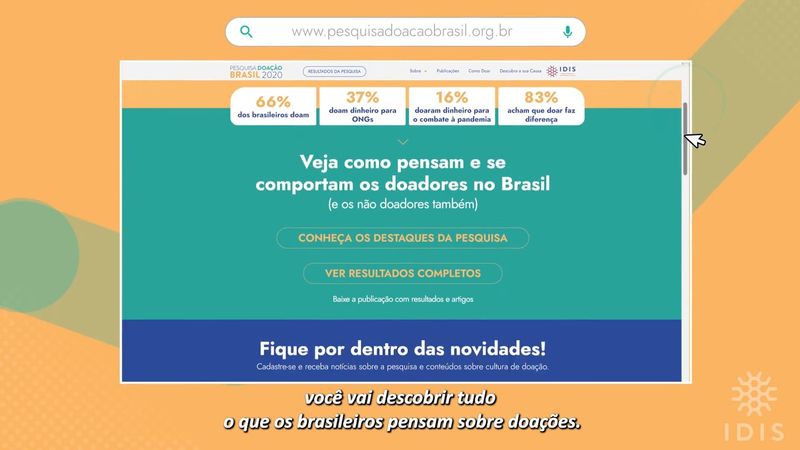
The Pesquisa Doação Brasil got a home of its own: a website that carried through two editions, where nonprofits and journalists find the figure they need, cross it with the breakdown they want and download the full survey by leaving their contact. A deep study, now easy to take in.
Credits
2022- Client
- IDIS
- Research by
- Ipsos
More projects from our portfolio
 View case
APAE Brusque
From offline to digital
Consulting View case
Conectas Direitos Humanos
Doe e Ganhe
Thematic campaign View case
Fundo Brasil
S.O.S Amazonas
Emergency campaign View case
Fundo Brasil
RS pede ajuda!
Emergency campaign View case
Conectas Direitos Humanos
Climate crisis: What if…?
Thematic campaign View case
Instituto Engenheiro Joaquim Correia (IEJC)
Futures are built
Consulting View case
Fundo Brasil
Massacre in Complexo do Alemão
Emergency campaign View case
Proteção Animal Mundial
Online media, month after month
Media management View case
Fundo Casa Socioambiental
Building Climate Justice
Thematic campaign View case
Conectas Direitos Humanos
Disinformation and Municipal Elections (2024)
Thematic campaign View case
Fundo Brasil de Direitos Humanos
Direct mail on human rights
Direct mail View case
Fundação Otacílio Coser
Fundação Otacílio Coser and Programa Escolaí
Communications management View case
DāUna
A brand grown from the soil
Visual identity View case
Instituto E+ Transição Energética
Energy explained in one minute
Explainer videoGet in touch
Shall we talk?
Tell us about the cause you champion.