
Energy explained in one minute
Instituto E+ · Explainer videos
Technical studies on the energy transition became one-minute explainer videos, ready for social media.
Instituto E+ studies the transition to renewable energy alongside the sectors that drive the economy, such as industry. These are dense studies, written by specialists. The challenge was taking that knowledge out of the report and into society, so people realize the energy transition is their business too.
From specialists to everyone
The studies speak to industry; the videos, to society.
One minute
The attention span of social media, without losing the data.
Hear and see
Narration and infographics tell the same story together.
Made to travel
A format that runs on many channels.
A technical study, told in sixty seconds.
Each video starts from a topic in E+'s studies and becomes a short story: a concept explained in one sentence, a chart that moves and an invitation to learn more.
Technical, but digestible
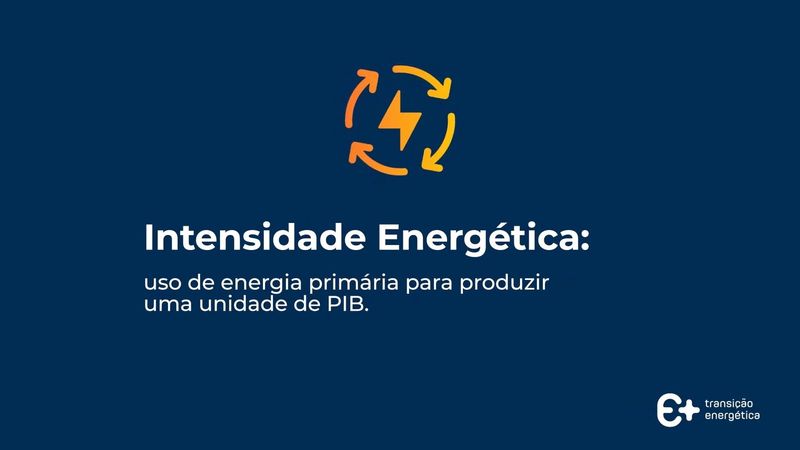
Energy intensity is a concept with a hard name. The video settles it in one sentence: it is how much energy a country uses to produce wealth. The lower it is, the more efficient the country.
Narration and drawing on the same beat
The voice leads and the drawing follows: every sentence gets an icon, a number or a line on screen, in step with the speech. You can follow it by listening, by watching or both.
The data moves
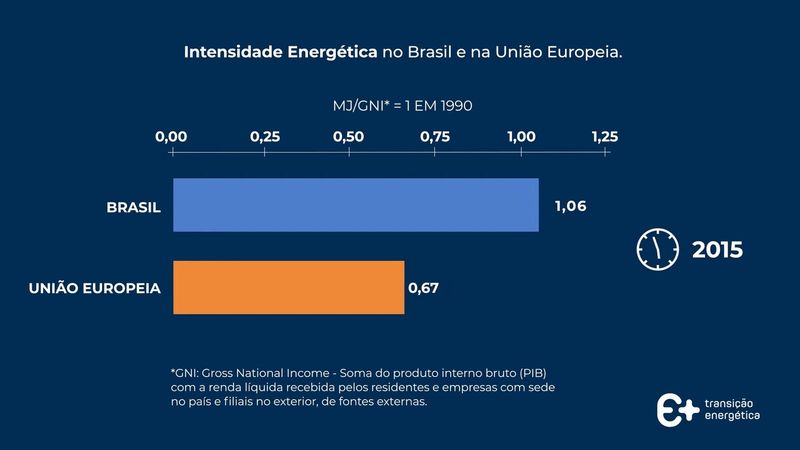
Instead of a table, the chart travels through time: a clock marks the years while the bars for Brazil and the European Union change size. In a few seconds it is clear that Europe became more efficient and Brazil did not.
One minute, made to travel
At about one minute, the video speaks the language of social media and works across channels such as YouTube, Instagram and TikTok. At the end, it points to the full studies on the E+ website.
The artwork
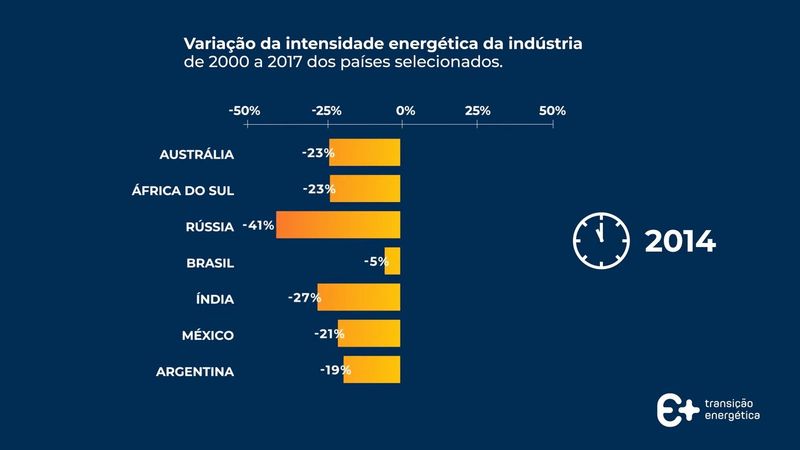
Frames from the video, from the title to the last chart.
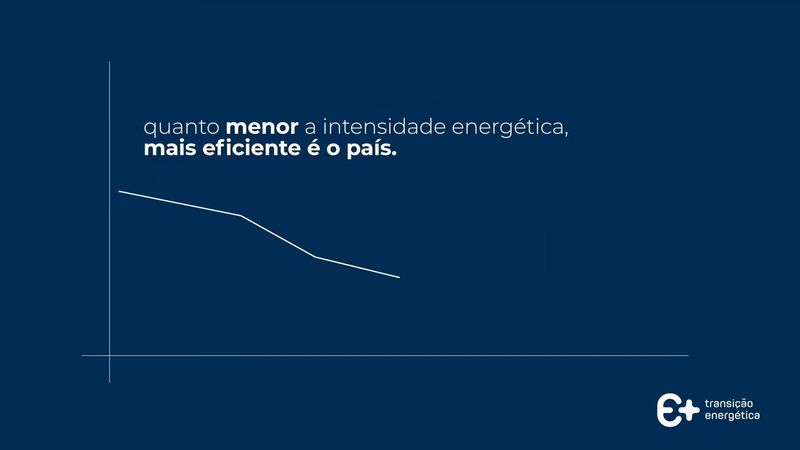
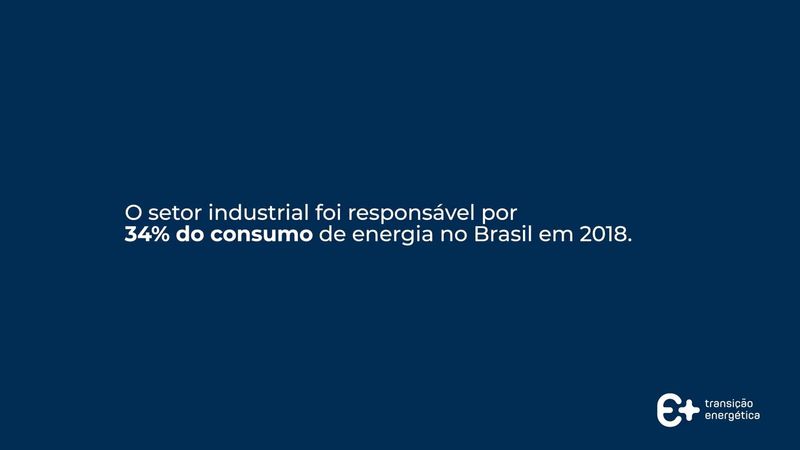
E+ gained a format to take its studies beyond specialists: short videos, with narration and data drawn on screen, that explain the energy transition to people who have never read a report on the subject, and end by inviting them to the full studies.
Credits
2020- Client
- Instituto E+ Transição Energética
More projects from our portfolio
 View case
APAE Brusque
From offline to digital
Consulting View case
Conectas Direitos Humanos
Doe e Ganhe
Thematic campaign View case
Fundo Brasil
S.O.S Amazonas
Emergency campaign View case
Fundo Brasil
RS pede ajuda!
Emergency campaign View case
Conectas Direitos Humanos
Climate crisis: What if…?
Thematic campaign View case
Instituto Engenheiro Joaquim Correia (IEJC)
Futures are built
Consulting View case
Fundo Brasil
Massacre in Complexo do Alemão
Emergency campaign View case
Proteção Animal Mundial
Online media, month after month
Media management View case
Fundo Casa Socioambiental
Building Climate Justice
Thematic campaign View case
Conectas Direitos Humanos
Disinformation and Municipal Elections (2024)
Thematic campaign View case
Fundo Brasil de Direitos Humanos
Direct mail on human rights
Direct mail View case
Fundação Otacílio Coser
Fundação Otacílio Coser and Programa Escolaí
Communications management View case
DāUna
A brand grown from the soil
Visual identity View case
IDIS
A deep survey, easy to read
Data platformGet in touch
Shall we talk?
Tell us about the cause you champion.